Developer Experience: How to Measure and Improve It
Your engineering dashboard says lead time improved. Your quarterly survey says developers are frustrated. Both results can be true, and neither tells you what to fix. Developer experience becomes useful only when you connect system behavior to the evidence of the people moving through it.
I have seen engineering leaders react to that contradiction in two predictable ways. Some trust the dashboard and dismiss frustration as perception. Others buy a developer portal because the survey mentions tooling. Both responses skip the diagnosis.
Developer experience is not a score. It is an observable property of the engineering system: how quickly developers receive useful feedback, how much unnecessary context they must hold, and whether they can finish meaningful work without avoidable interruption.
That distinction changes the decision. You are no longer asking, “Are developers happy?” You are asking, “Which conditions prevent this group from delivering safely, and what evidence would justify changing them?”
One number cannot represent the work
Section titled “One number cannot represent the work”A single metric is attractive because it fits on a dashboard. It is also easy to misunderstand.
Commit counts reward smaller commits. Pull-request counts encourage teams to split work mechanically. Lead time may improve while environment setup, incident interruptions, or cross-team approvals get worse. A satisfaction score can reveal pain without locating its source.
The SPACE framework, published by Nicole Forsgren and colleagues in 2021, rejects the idea that developer productivity can be captured by one metric. It describes five dimensions: satisfaction and well-being, performance, activity, communication and collaboration, and efficiency and flow.
The point is not to place five numbers beside the old one. It is to prevent one observable behavior from becoming a false definition of productivity.
I would never use commits, lines changed, coding hours, or tickets closed to rank developers. Those measures are sensitive to role, task shape, codebase, and collaboration. Once attached to performance management, they stop being useful evidence and become targets.
Measure at the level where you can improve a system: a team, a service journey, or a workflow. Tell developers what you collect, why you collect it, who can see it, and which decision it will support. If you cannot name the decision, do not collect the metric.
Observe conditions and outcomes together
Section titled “Observe conditions and outcomes together”The 2023 DevEx framework organizes the conditions of developer work into three dimensions:
- feedback loops: how quickly and clearly work produces an answer;
- cognitive load: the mental effort required to complete a task;
- flow state: the ability to stay focused on engaging work.
These dimensions give you questions that developers can answer. How often does a code review wait more than a working day? Can a developer understand why a deployment failed? How many systems must someone learn to create a routine service? How often does unplanned work interrupt a focused block?
Pair those answers with telemetry. For code review, compare reported waiting and context switching with median and tail review time. For deployment, combine perceived difficulty with task success, elapsed time, failed attempts, recovery time, and support requests.
Neither side is subordinate. Telemetry tells you what the system recorded. Developers tell you what the system required of them.
The distinction matters because averages conceal uneven experiences. A four-minute median build looks healthy until you discover that payments-api takes twenty-six minutes after integration tests enter the path. A two-hour median review time looks healthy until security-sensitive changes wait three days for one specialist.
The 2023 DevEx in Action study surveyed more than 2,000 developers. Developers reporting significant deep-work time felt 50 percent more productive. Those reporting high understanding of their code felt 42 percent more productive. Fast code-review turnaround was associated with 20 percent higher perceived innovation.
Those are associations from a cross-sectional study, not promises. You should not turn “deep work” into a target and expect a 50 percent output gain. You should use the findings to form a local hypothesis, then test it in your environment.
Follow one journey from start to finish
Section titled “Follow one journey from start to finish”Organization-wide DevExDeveloper ExperienceThe conditions, interactions, and feedback that shape how developers complete software delivery work. averages produce broad discussions. A journey produces an intervention.
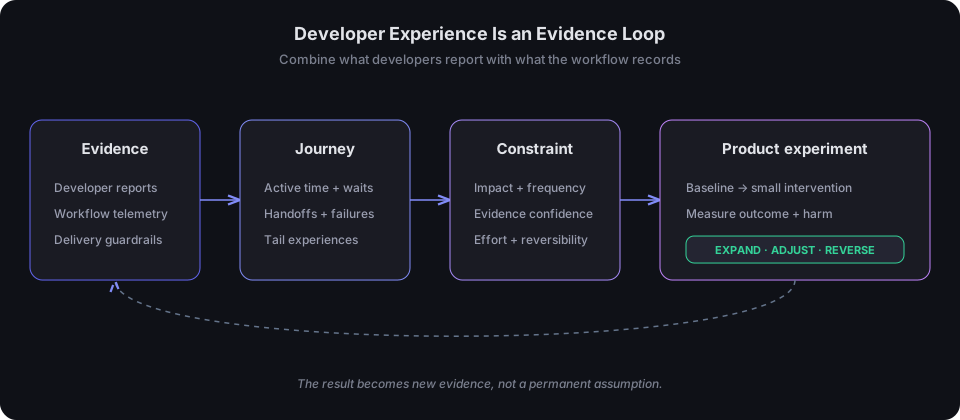
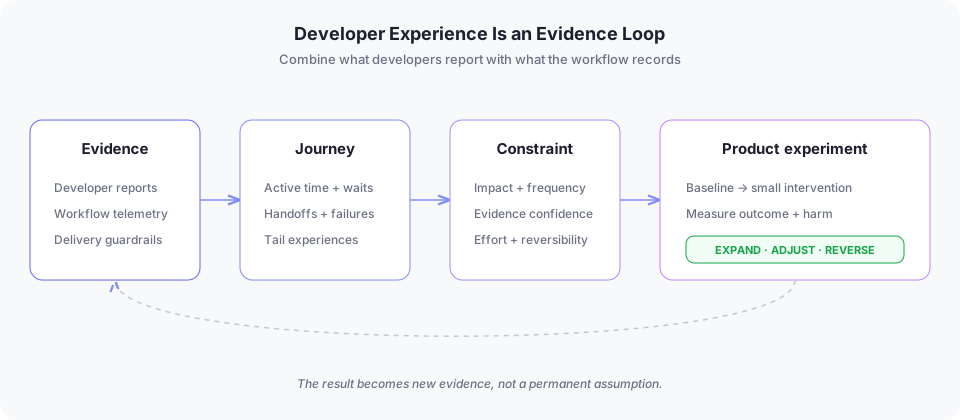
Take the path from repository creation to the first production deployment of orders-api. Ask one developer to complete it while you observe. Record active work, waiting, handoffs, failures, questions, support requests, and the decisions that require undocumented knowledge.
You may discover that repository creation takes four minutes, pipeline configuration takes twelve, and access approval waits two days. Optimizing the template will not change the outcome. The constraint is the approval path.
I have seen teams measure “time to first deploy” from the first commit, even though developers had already spent days finding the correct template, requesting an account, and learning which group owned the environment. The metric was precise. Its boundary made it useless.
Define the journey from the user’s intent to a successful outcome. Segment the evidence by team, workload type, seniority where appropriate, and supported versus exceptional paths. Inspect the tail, not only the median.
Then talk to the people in that tail. A dashboard can show that ten percent of deployments take more than an hour. It cannot tell you whether those deployments involve unclear errors, slow tests, scarce reviewers, or a justified safety control.
This is where the earlier Platform Engineering article connects. A platform team should not begin with a feature roadmap. It should find repeated developer journeys where shared capabilities can remove verified friction.
Prioritize constraints, not tools
Section titled “Prioritize constraints, not tools”Once you investigate several journeys, you will have more problems than capacity. Rank constraints before discussing solutions.
Use four practical factors:
- impact on a delivery, quality, or well-being outcome;
- number and frequency of affected developers or journeys;
- confidence in the evidence and diagnosis;
- effort and reversibility of the intervention.
Suppose slow reviews affect sixty developers every week, correlate with repeated context switching, and concentrate in two ownership bottlenecks. That deserves attention before replacing an IDE plugin disliked by five people.
The intervention might not be software. Clearer ownership, smaller review boundaries, scheduled reviewer capacity, or a changed approval policy may outperform a new platform component.
This protects you from the generic DevEx wishlist: portal, catalog, faster CI, local environments, AI assistant, documentation search. Any of those can help. Any can also add another interface, migration, or source of cognitive load.
DORADevOps Research and AssessmentA research program that measures software delivery performance through four key metrics: deployment frequency, lead time, change failure rate, and recovery time.’s 2024 research makes that tradeoff visible. Internal developer platforms were associated with better individual productivity and team and organizational performance, but the report also warned about reduced change stability and throughput. Adoption alone is not success.
Run the improvement as an experiment
Section titled “Run the improvement as an experiment”A DevEx program should operate like a product, not a measurement office.
For the selected constraint, write a hypothesis: “If orders-api developers can create a compliant test environment without a ticket, median waiting time will fall from two days to under thirty minutes, without increasing failed deployments or policy exceptions.”
Establish the baseline before changing the path. Ship the smallest intervention to a partner team. Measure task success, waiting time, support demand, developer confidence, and the delivery guardrails that could reveal harm.
Keep a short qualitative check. Ask what became easier, what became harder, and what work moved elsewhere. Automation often removes a visible step while transferring complexity to debugging or exception handling.
Publish the result, including a failed result. This is how developers learn that surveys lead to decisions rather than disappearing into a quarterly presentation.
Then choose: expand, adjust, or reverse. A change that increases adoption but worsens successful completion is not an improvement. A change that saves ten minutes twice a year may not justify its operating cost. A small change that removes a weekly two-day wait probably does.
Start this week with one journey, not a company-wide DevEx score. Choose a task developers complete often, observe five real attempts, and combine what people report with what the workflow records. Name the largest verified constraint and write the smallest reversible experiment that could remove it.