Measuring AI ROI: Stop Counting Speed, Start Counting Cost Per Task
Your quarterly AI adoption report says developers are 30% faster. Your CFO nods. And neither of you knows whether AI is saving money or quietly draining it. Uber’s engineers adopted Claude Code so fast that 84% were using it daily by March 2026. The company burned through its entire annual AI budget by April.
The problem is not that AI tools lack value. The problem is that most organizations measure the wrong things: developer satisfaction surveys, lines-of-code deltas, and throughput gains on isolated tasks. None of these tell you whether you are spending less to ship the same work, or spending the same to ship more. I have yet to see a quarterly AI report that answers the one question a CFO actually cares about: what did we get for the money?
The speed mirage
Section titled “The speed mirage”I keep seeing the same dashboard in every organization I advise. PR count is up. Task completion is up. Developers report feeling productive. And nothing has changed at the delivery level.
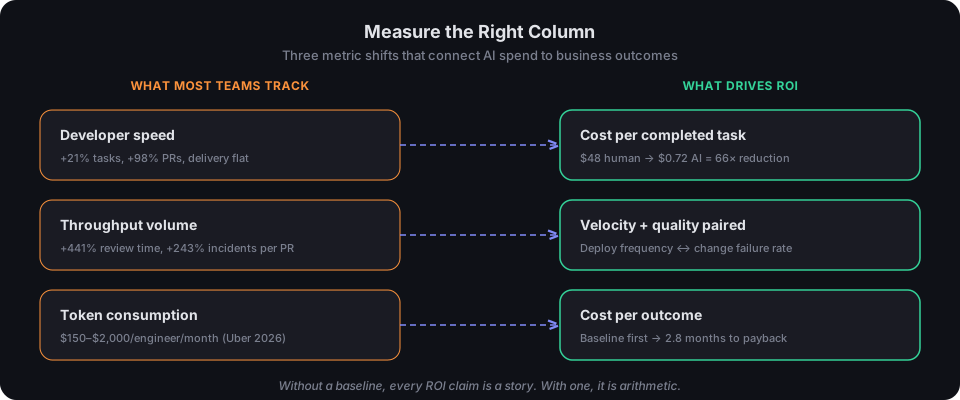
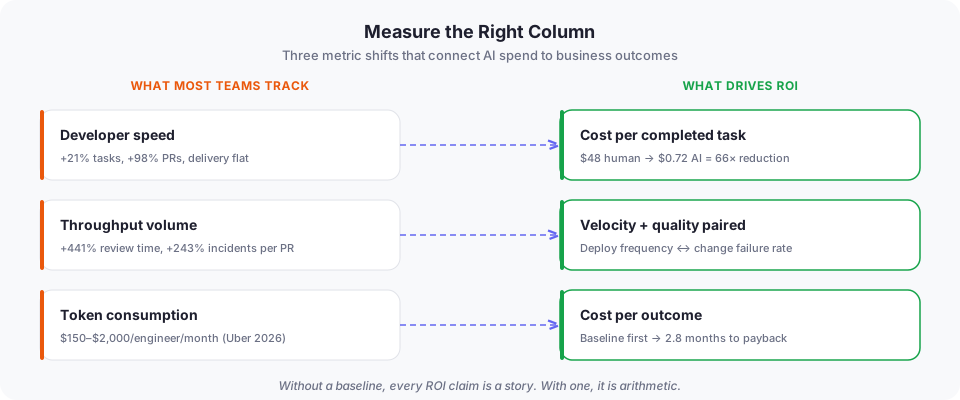
The Faros AI analysis of the 2025 DORA Report measured this across 22,000 developers: individual developers completed 21% more tasks and merged 98% more pull requests. Organizational delivery metrics stayed flat. Features shipped to customers did not increase.
Google’s DORA State of AI-assisted Software Development report confirmed the pattern: AI adoption improves throughput by 2-18%, but change failure rates go up. The team introduced Rework Rate as a fifth metric in 2025 precisely because AI-generated code creates more of it. Three of the four original DORADevOps Research and AssessmentA research program that measures software delivery performance through four key metrics: deployment frequency, lead time, change failure rate, and recovery time. metrics lose their signal when AI generates 30-70% of committed code. Deployment Frequency and Lead Time for Changes become noise when the code was not written by the person who committed it. Mean Time to Recovery is the only metric that still tracks real delivery performance.
Larridin’s telemetry study across 22,000 developers puts numbers on the downstream cost: median time in PR review jumped 441%, and incidents per PR rose 242.7%. For every merge, the probability of a production incident has more than tripled. The bottleneck did not disappear. It moved from writing to reviewing, testing, and recovering. I cover the full mechanics of this shift in The AI Paradox: Why Coding Faster Can Slow Down Your Deliveries.
If your measurement stops at the developer’s screen, you are measuring the accelerator without checking the brakes.
Cost-per-task is the metric that connects spend to outcomes
Section titled “Cost-per-task is the metric that connects spend to outcomes”Here is a number you can act on: a routine code review costs $48 when a senior engineer does it and $0.72 when an AI agent handles it. That is a 66x cost reduction, per Forrester Total Economic Impact studies.
But “cost per token” tells you nothing useful. A single AI coding task costs between $0.03 and $0.13 depending on the model, according to Aider’s polyglot benchmark across 225 exercises. The same engineer, same tool, same workday can produce wildly different invoices depending on whether they run autocomplete or orchestrate parallel agents across a monorepo.
Uber learned this at scale. After rolling out Claude Code to 5,000 engineers in December 2025, Fortune’s investigation into Uber’s AI spending revealed monthly cost per engineer ranged from $150 to $2,000. CTO Praveen Neppalli Naga spent $1,200 in a single two-hour demo session. The company had ranked engineers on internal leaderboards by Claude Code usage, creating a cultural incentive to consume tokens with no feedback loop on whether those tokens produced useful outcomes. COO Andrew Macdonald later said it was getting harder to justify rising token costs without evidence they produced more useful features for customers.
This is the new cost reality that most engineering budgets have not caught up with. DX’s 2026 survey of engineering leaders shows 38.4% spending $101-500 per developer per year on AI tools, and 10.5% already above $1,000 per year. But agentic tools cost $200-$2,000+ per engineer per month in token spend. The gap between what finance planned for and what engineering consumed is where budget surprises live.
The metric that closes this gap is cost per completed task. Not cost per seat. Not tokens consumed. How much did it cost to ship that PR, generate that test suite, write that migration? Here is what that looks like in practice: tag each AI-assisted task with the project, the task type (review, generation, test, docs), and the model used. At the end of the sprint, divide total AI spend for that project by the number of completed tasks. Compare against the human baseline. That ratio is your ROI signal. Everything else is noise.
Speed without quality is not ROI
Section titled “Speed without quality is not ROI”In March 2026, Amazon’s retail website suffered multiple high-severity outages in a single week. On March 2, Amazon’s AI coding assistant Q caused a series of retail website outages resulting in 1.6 million errors and 120,000 lost customer orders. Three days later, a production change deployed without the required approval process caused a 99% drop in North American orders: an estimated 6.3 million lost orders.
Amazon’s internal investigation pointed to a “trend of incidents” tied to “Gen-AI assisted changes.” SVP Dave Treadwell called a mandatory deep-dive for retail technology leaders. The company launched a 90-day code safety reset across 335 Tier-1 systems: mandatory two-person approvals and required senior review for AI-generated code.
I think of this as the ROI blind spot. If your measurement framework tracks speed but not stability, you will celebrate velocity gains right up until the incident that costs more than a year of productivity savings. Amazon’s outages are an extreme case, but the pattern is the same at every scale. Every team that ships faster without adapting its review and testing process is accumulating quality debt that will come due.
Pair every velocity metric with a quality metric. Track deployment frequency alongside change failure rate. Track PR throughput alongside rework rate. Track cost-per-task alongside mean time to recovery. If velocity goes up and quality does not hold, you do not have an ROI story. You have a risk story with a fuse attached.
The biggest ROI accelerator is a baseline
Section titled “The biggest ROI accelerator is a baseline”Gartner’s Agentic AI Pulse (2026) found that only 41% of agent rollouts cross positive ROI within 12 months. Nineteen percent never reach payback. The cause is almost never agent capability. It is evaluation drift, governance gaps, and unmeasured rework.
The baseline also defines how much autonomy the process can support. Before expanding an agent’s authority, use the decision matrix in AI Agents in the Enterprise to test error cost, reversibility, observability, and the action boundary.
Bain’s Agentic AI Benchmark (2026) contains the most useful data point I have found on this topic: projects with a documented baseline before deployment reach payback in 2.8 months. Projects without one stretch past 14 months. The median payback for engineering AI projects is 9.3 months, but that number hides a variance driven almost entirely by measurement discipline, not tool quality.
That is a 5x difference in time-to-value. Before you deploy any AI tool to your engineering organization, capture four numbers:
- Current cost per task for the work you plan to automate
- Current cycle time for that work
- Current error or rework rate
- Current review load
These do not need to be precise. Two weeks of rough tracking is enough to build a baseline that turns ROI from storytelling into arithmetic.
Once that baseline exists, From AI ROI Hypotheses to Kill Criteria: Managing an AI Initiative Portfolio turns the evidence into a fund, pause, pivot, or stop decision for the next tranche.
I have seen teams overcomplicate this. They build elaborate dashboards before they have a single data point. Start with a spreadsheet. Track three tasks. Capture the before-numbers this week, deploy the tool next week, and compare at the end of the month. If the tool pays for itself on those three tasks, expand. If it does not, you have saved yourself from scaling a loss.
What to do Monday morning
Section titled “What to do Monday morning”Pick three routine tasks your engineers perform every week: code review, test generation, documentation updates. For each one, estimate the current cost by multiplying average time spent by loaded hourly rate. Deploy your AI tool on those tasks for two sprint cycles. Then measure the new cost-per-task alongside the downstream quality indicators: rework rate, incident count, and review time.
If cost-per-task dropped and quality held, you have an ROI case you can defend to your board with numbers, not anecdotes. If cost dropped but rework climbed, you have a risk that needs governance before you scale. Governance here does not mean a committee. It means a review gate for AI-generated changes to production systems, and the cost of that gate is part of the ROI calculation.
The only useless answer is the one most organizations have today: “developers say they feel faster.”
Article series
AI Value Decision System
Explore every resource in this series, whatever its format.